See and Identify Network Resources When Provisioned for Topology and Inventory Visibility
The Containerized Visibility FabricSM (CVF) agents, deployed as containers in the network, can identify and monitor network events as they occur at the kernel level. The agents see this activity within its periphery, providing end-to-end observability with a CVF deployment in the network.

Observability is more than logs, metrics and traces.
This cloud-native, composable solution generates time-series topology information, in real-time, as network resources are provisioned and communicate across the infrastructure. The CVF populates a dynamic visualization; clients can also get time-series machine identification, performance, encrypted and protocol session metadata information.
Topology and Inventory with the CVF
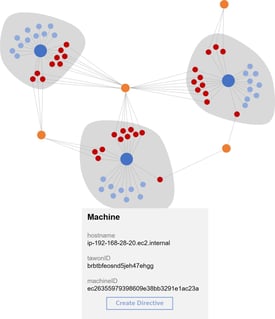
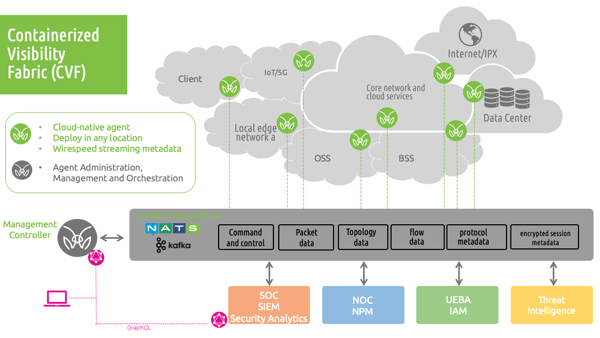
The Topology and Inventory function of the MantisNet CVF identifies and visualizes the resources and connections the agents "see" from their deployment on the network. The CVF, comprised of agents, controller and GraphQL for management, work together to stream network data to a Message Bus for consumption to follow-on analytic programs. Deployed MantisNet Agents performing the topology function can connect to other agents to produce an aggregate mapping visualization of the network resources. The topology output can include a lot of items, but it fundamentally provides output based on a schema (below) to produce the topology information that includes
information about the resources under control- Flow data, machine info, processes running, process IDs, container information, etc.
| Parameter Name | Description | Data |
| Machine | Defines the machine / node / server | ID, Name, Timestamp |
| Container | Description of the container | Name, Namespace, Label, Image |
| Process | Process(es) running on a machine, in that namespace | PID, Name, Namespace, CMD |
| Link / Interface | Network interfaces on that machine / node / server | Name, Address, State, MTU |
| Subnet | Active subnet connections | IP Address, Mask |
| Flow | Information transmitted and received over a specific link | Source, Destination, Packets, Bytes |
| I/O Statistics | Raw packet counts and statistics for a specific link | Rx, Tx, Errors, Drops |
Once you have the visualization of the network metadata you can then manage via the GraphQL API to perform a variety of other functions, with the output streamed to the message bus for ingestion by analytic and management tools. These other functions include - publishing protocol metadata, generate encrypted session metadata, plaintext and keys, flow statistics, etc.
The MantisNet CVF provides infrastructure observability from the kernel level, providing unprecedented real-time, streaming visibility to the resources communicating on your network edge or core. The GraphQL management interface enables control of the network resources from the MantisNet CVF Agent.
The CVF architecture is an innovative combination of network sensor agents, and cloud native technologies that efficiently produces all the information necessary to monitor the cryptographic status and health of your infrastructure as well as feed follow-on analytic solutions for decryption management and forensic analysis.

Learn more about the containerized visibility fabric.

